This is my 3rd-year dissertation project at Newcastle University, exploring the machine learning techniques for a line following robot. This was a really good opportunity for me to learn basic Machine Learning techniques. I have made all of the source code available here, with the hope of this being a fun educational project for those who want to learn machine learning, whilst getting to play around with a robot!
How does it work?
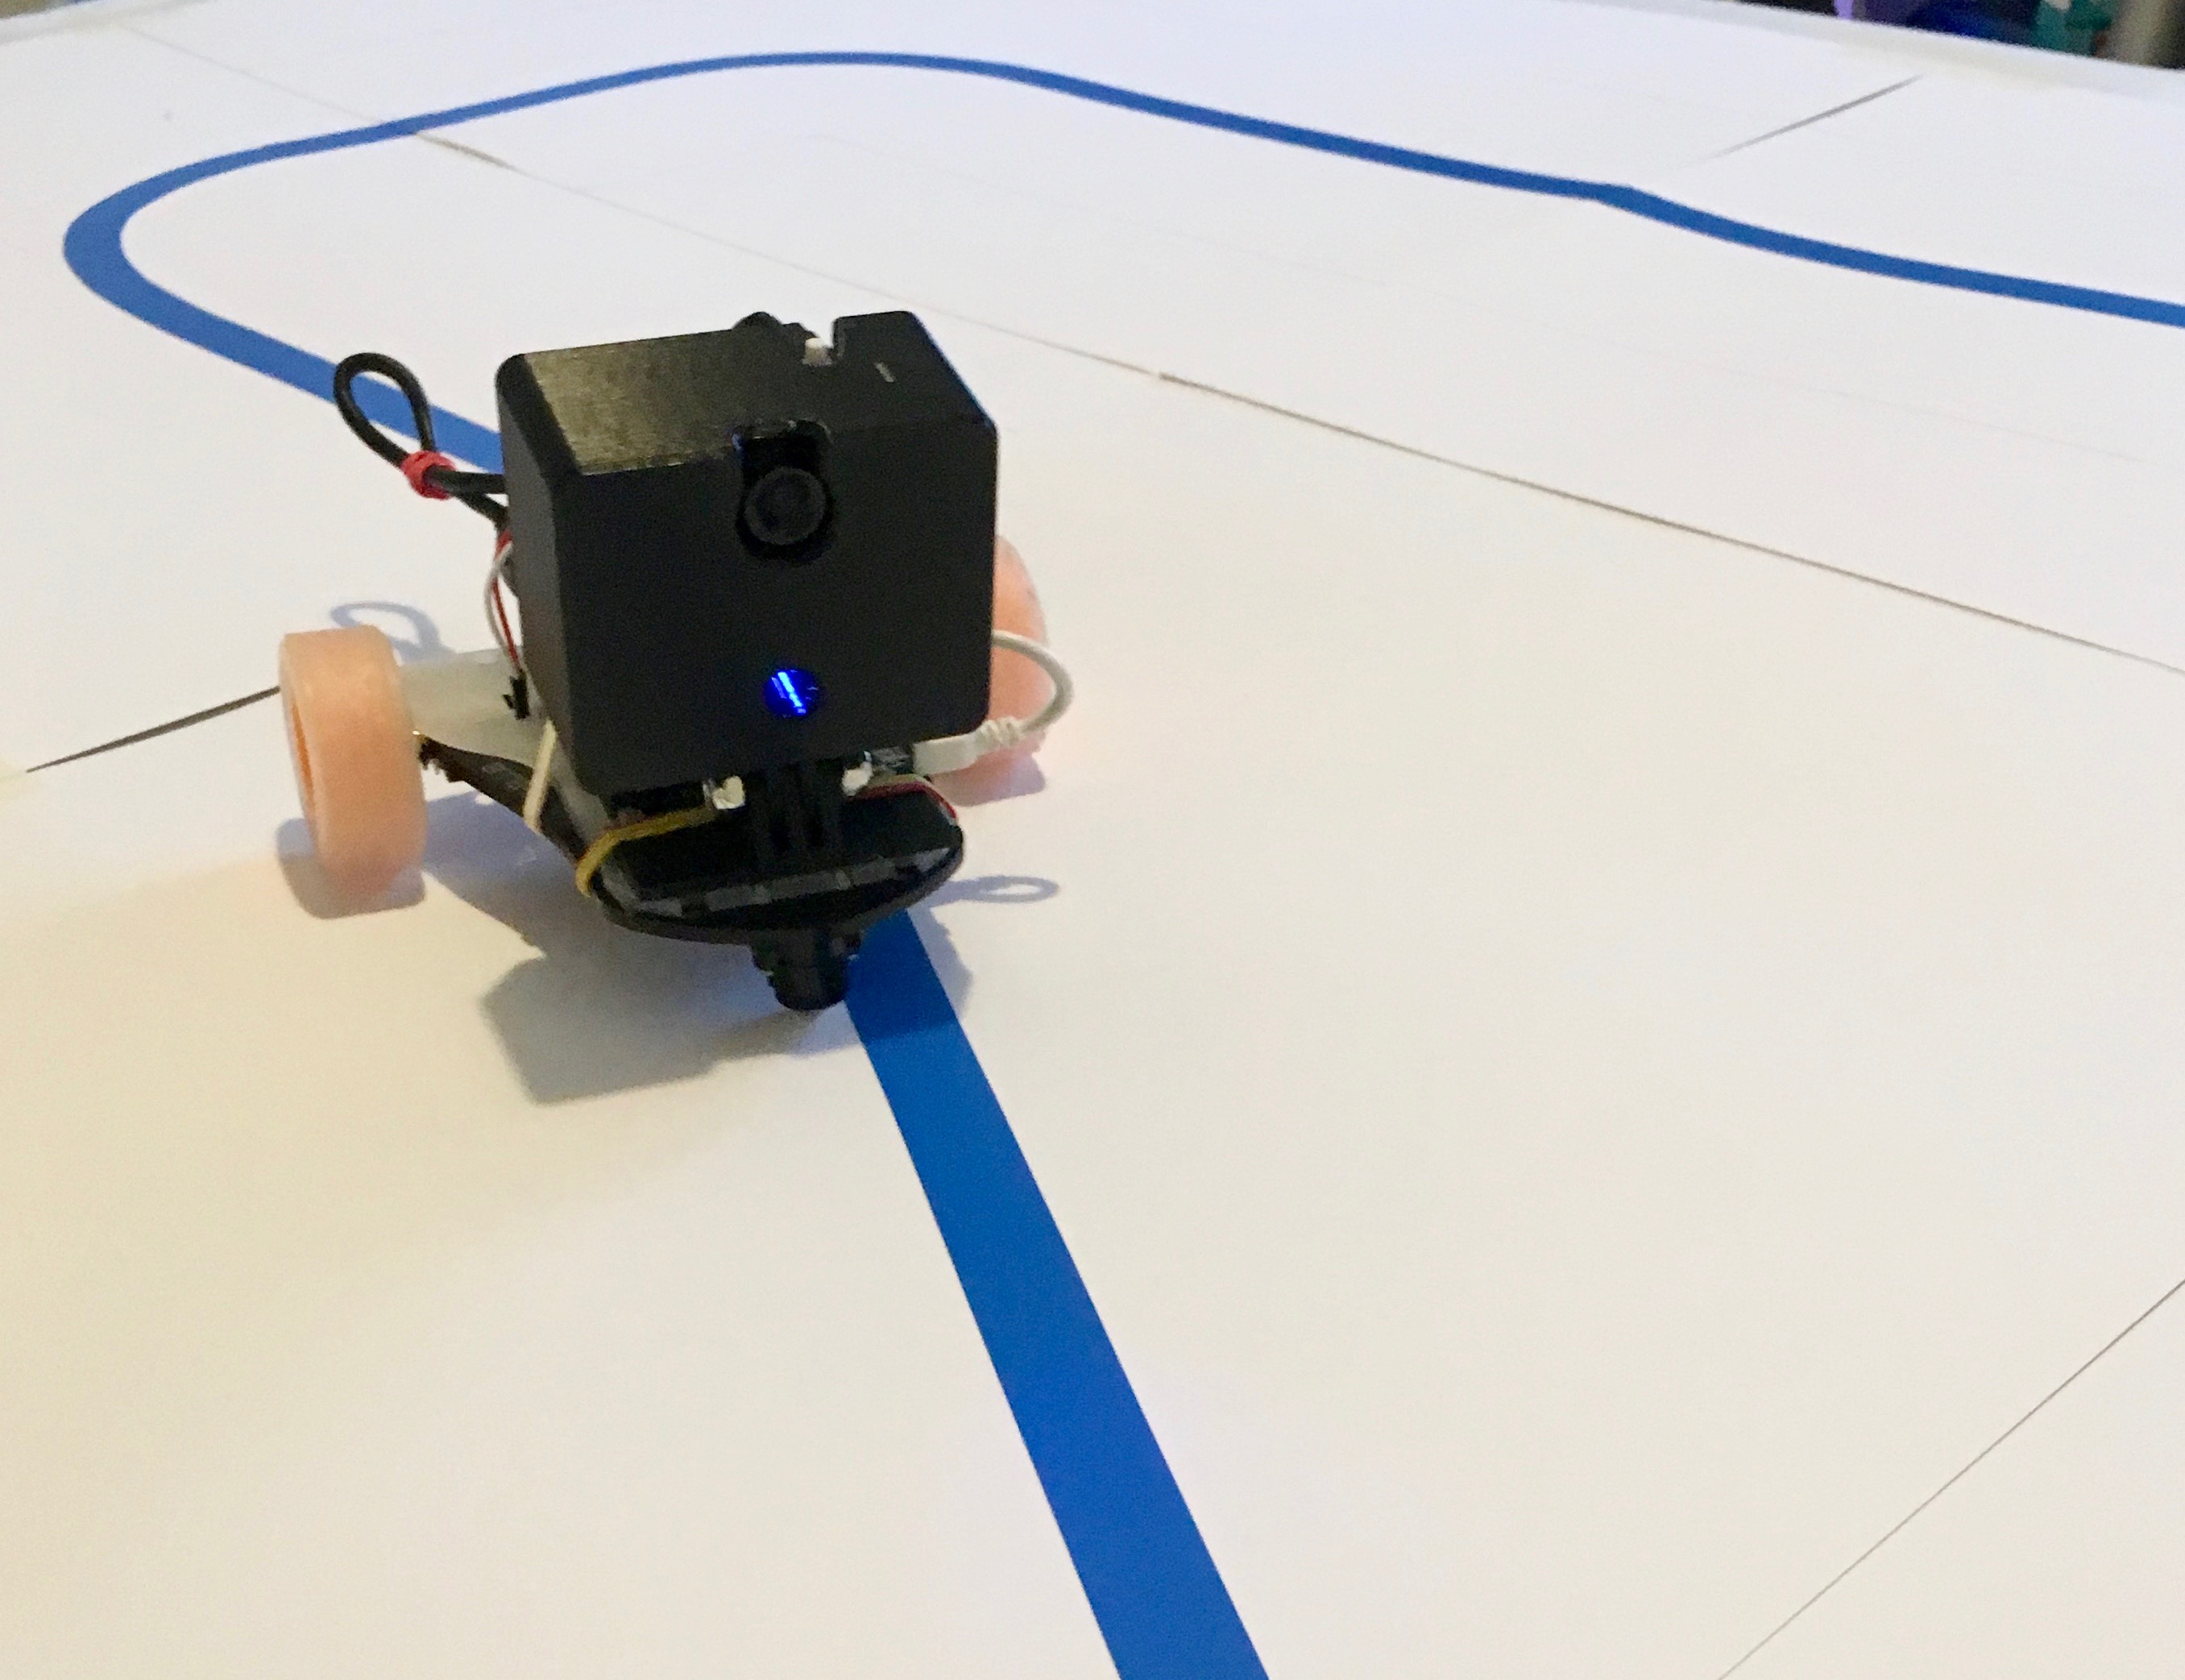
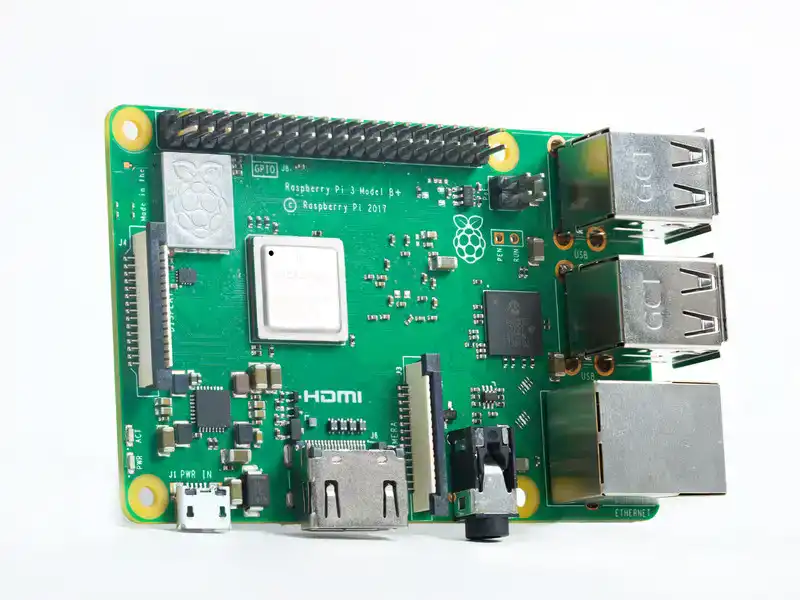
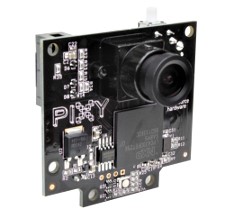
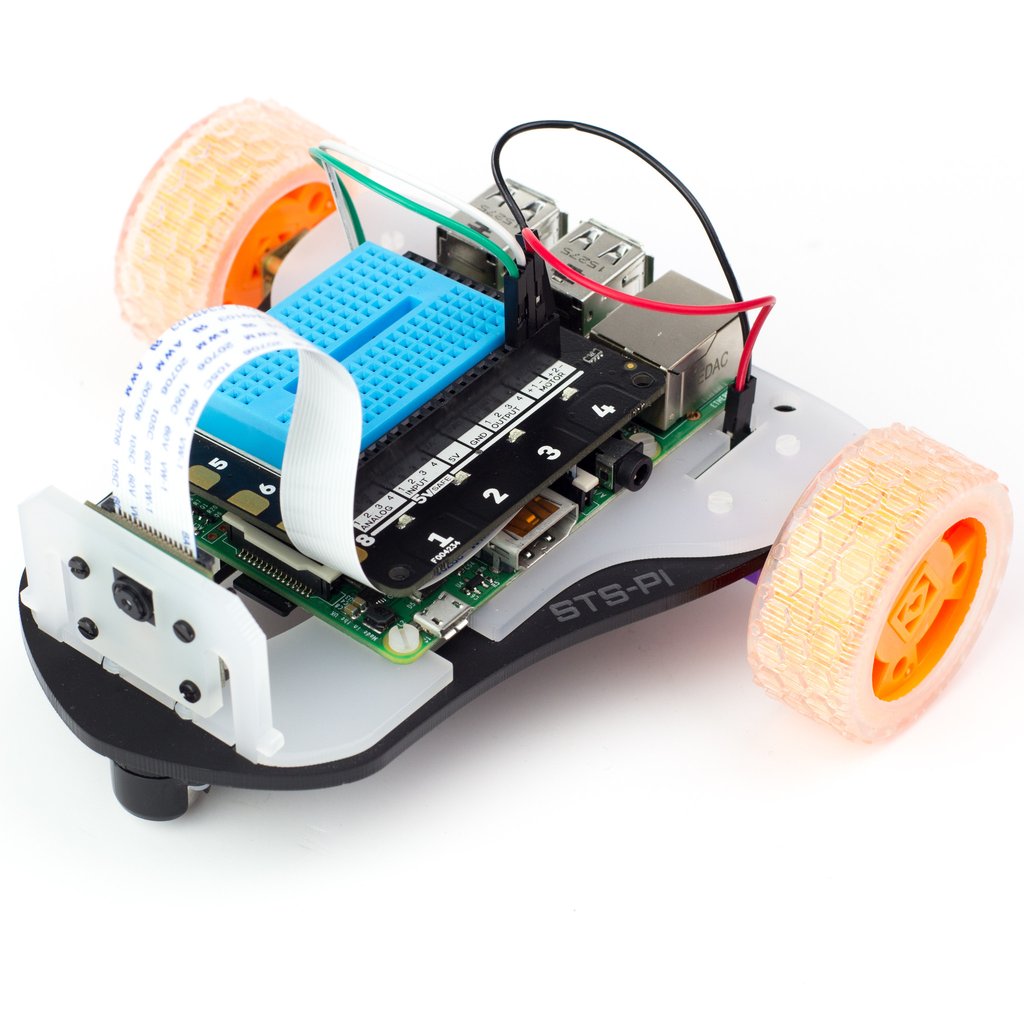
The robot used in this project uses a Raspberry Pi 3 Model B+, with a connected vision sensor called Pixy, developed by CharmedLabs. Pixy can be trained to recognise up to seven distinct colours, at 50 frames every second (50Hz). After training Pixy, it will draw bounding boxes over the areas in the image where that colour occurs. After training Pixy the colour blue, and pointing Pixy to a blue line, the resulting bounding boxes may look something like this:
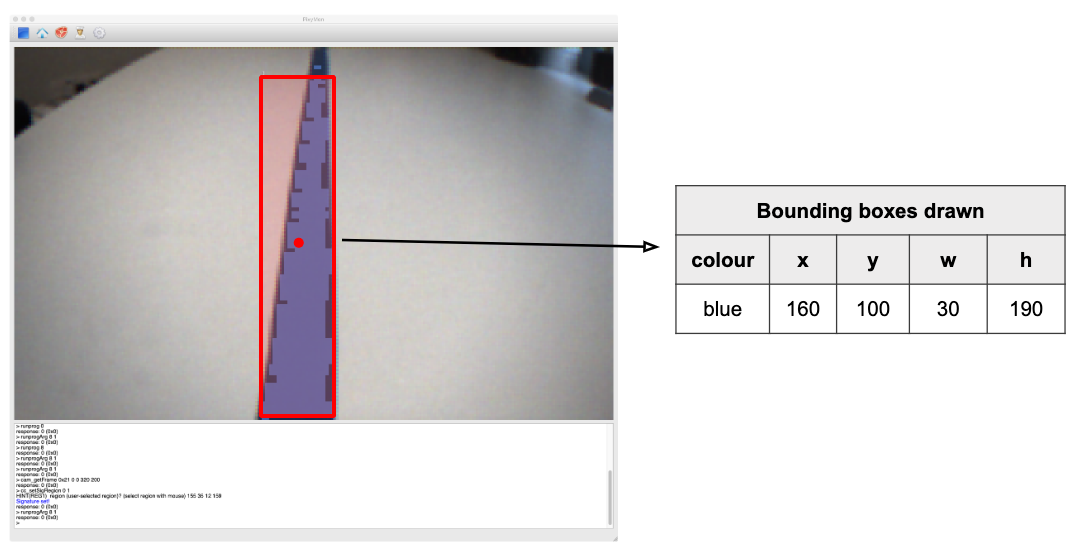
For more details about Pixy's colour training process, have a read through this page. The idea behind this project is that by driving the robot around a track (following a coloured line) using a game controller (such as a PlayStation controller), we can record the data that Pixy gives us along with the data that the controller outputs. So long as your driving skills are good enough, the data should give a good mapping between what the robot sees, and which way it should move. In the case that you are really bad at driving a robot around the track, I have made all of the data I collected available here
What you'll need
You'll need all of the hardware below to get going with this project. An important note is that this project uses the original Pixy camera, although you could buy the original, it may be worth buying the more recent Pixy 2. You will also need a micro USB cable to connect the Pixy to the Pi.
| Hardware | Price | ||
|---|---|---|---|
|
Raspberry Pi 3 Model B+ | £34 | Buy |
|
Pixy Camera | £60 | Buy |
|
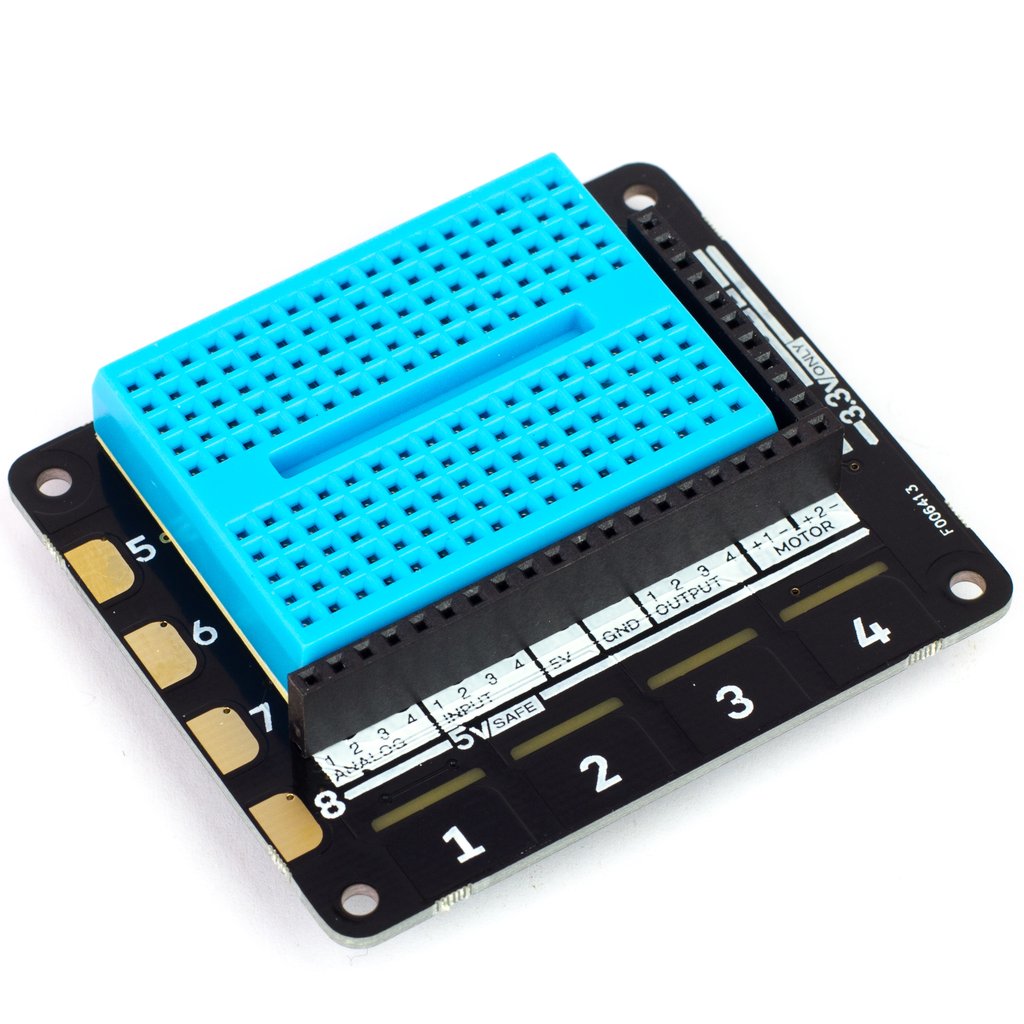
Explorer HAT Pro | £22.50 | Buy |
|
Explorer HAT Pro | £19.50 | Buy |
|
Power Bank | £15+ | Buy |
| Total: | approx £150 | ||
Collected Data
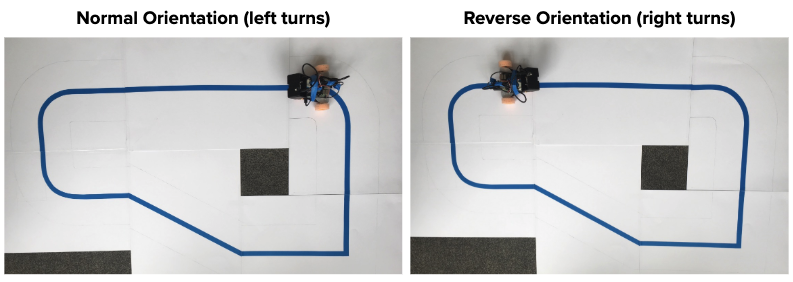
A total of 40 laps of data was recorded on the track (a total of ~2 million frames recorded by the camera)
a_1 to a_5 are all left turns (normal orientation on track)
b_1 to b_5 are all right turns (reverse orientation on track)
| Dataset # | Orientation on track | Number of laps recorded | Number of samples recorded |
|---|---|---|---|
| a_1 | Normal | 4 | 237,763 |
| a_2 | Normal | 4 | 221,348 |
| a_3 | Normal | 4 | 230,029 |
| a_4 | Normal | 4 | 231,996 |
| a_5 | Normal | 4 | 229,798 |
| b_1 | Reverse | 4 | 235,857 |
| b_2 | Reverse | 4 | 231,088 |
| b_3 | Reverse | 4 | 228,466 |
| b_4 | Reverse | 4 | 230,556 |
| b_5 | Reverse | 4 | 226,914 |
| Total | 40 | 2,303,815 |
Visualising the collected Data
Below is a visualisation of the collected data (a_1.json to be precise), using this p5.js sketch. Click play to see it run!
Results
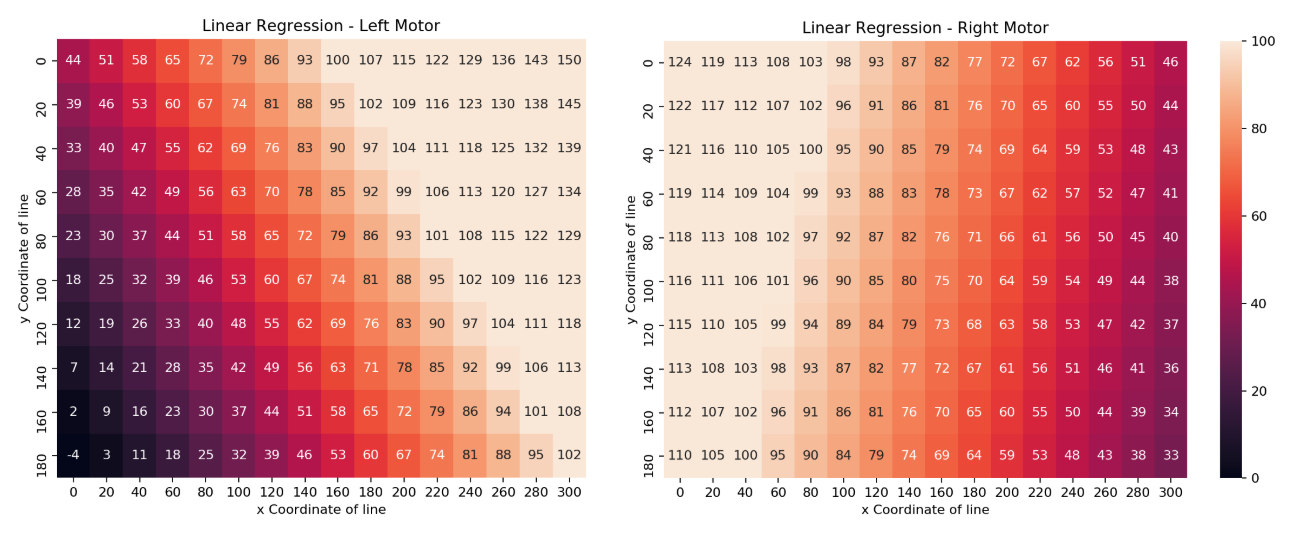
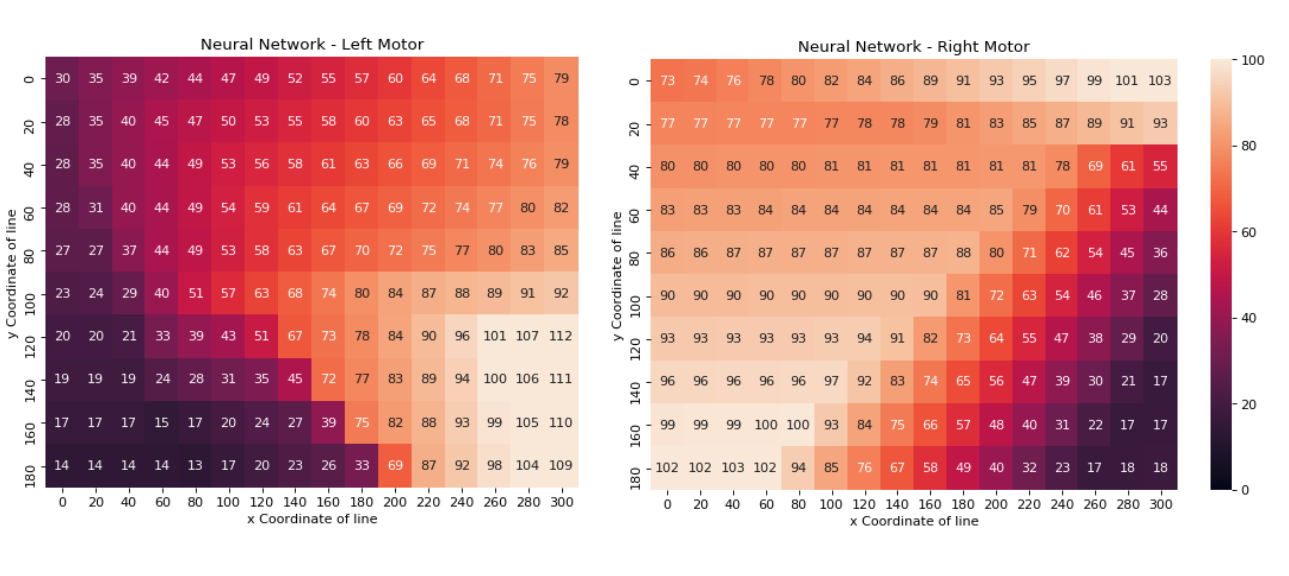
Two models were built, one using Linear Regression & one using Neural Network. The heatmaps below show what each model has learnt. Each cell on the heatmap represents an area of the frame that the camera could detect the line - a dark colour represents a low power to the motor, and a light colour represents a high power to the motor. There are two plots per model - one for the left motor and one for the right motor.